
Understanding the Dynamic Electorate: What Our AAPOR Research Reveals About Infrequent Voters
In our recent focus groups in Michigan, infrequent voters told us they’re exhausted, financially strained, and checked out from politics. They aren’t ideologues; they are pragmatic people reacting to their day-to-day economic reality.
The quantitative research BlueLabs presented at the American Association for Public Opinion Research (AAPOR) conference this year reinforces those findings, and reveals just how dynamic this group is – and why traditional polling methods so often miss them.
Our research highlights an important reality for the polling industry: we can successfully identify which voters are moving between election cycles, but those voters happen to be the hardest people to reach. If we don’t adapt our methods to find them, our data will miss the very people who often decide modern elections.
A Striking Shift Between Elections
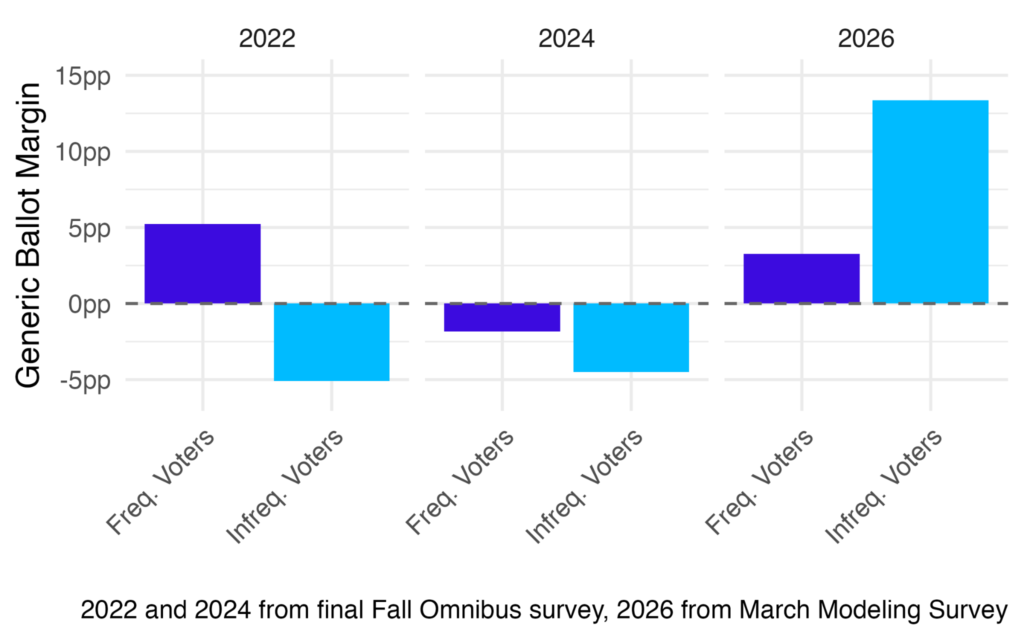
In today’s polarized political environment, we’re used to seeing voter segments move by a point or two between cycles. However, what we found among infrequent voters between 2024 and 2026, was a remarkably large shift.
According to our recent research, in 2024 infrequent voters broke for Donald Trump by 7.6 points – and they favored Republicans in the generic ballot by 5 points. By March 2026, that same group favored Democrats in the congressional generic ballot by over 13 points.
Shifts of this size, this fast, are highly unusual.
This swing suggests that infrequent voters don’t feel tied to a permanent partisan home. They’re reacting to economic conditions, political fatigue, and whoever is in power. Crucially, they’re highly responsive to messaging, which makes them both volatile and reachable.
Why These Voters Move
Why do these voters shift so dramatically between cycles? The short answer: they’re more persuadable than the rest of the electorate.
In a national survey of registered voters conducted earlier this year, we ran controlled ad-testing experiments to measure how political ads moved voters on the generic congressional ballot. The difference between frequent and infrequent voters was striking:
- Frequent voters showed a modest, predictable response of less than 1 percentage point of movement.
- Infrequent voters moved by over 2 points, nearly triple the impact.
One potential theory as to why: these voters generally tune out political media, so they haven’t built up the same resistance to political messaging. When a message speaks directly to their daily concerns, it lands. They are highly persuadable, but reaching them requires looking past standard outreach methods.
The Limitations of Web Panels
Reaching low-engagement voters is a significant challenge. Among frequent voters, our average survey response rate is 0.9%. Among infrequent voters, it drops to 0.3%, making them harder and more expensive to find at a time when the industry is under pressure to deliver faster, more cost-effective data. That pressure has pushed many pollsters toward a reliance on online panels. However, online panels present a real challenge when trying to study this specific group.
Even when we designed our outreach to recruit a sample that was 50% infrequent voters, our online panel came back 71% frequent voters. Live cell phone dialing, by contrast, produced a sample that was 81% infrequent voters. A web-only method risks interviewing an engaged politically active audience and missing the fluid voters who actually move the needle.
To address this, we use multiple modes of data collection – including live telephone interviews whenever possible. Additionally, we intentionally oversample lower-engagement voters using custom response propensity models.
Rethinking the Likely Voter Screen
Surveys often ask respondents how likely they are to vote, then filter out anyone who says “probably not” or “definitely not.” Our data suggests that this practice can cause bias. When we matched 2024 survey responses against actual turnout data from the 2024 election, we found that 54% of respondents who said they would “probably not” vote actually ended up casting a ballot, as did 29% of respondents who said they would “definitely not” vote.
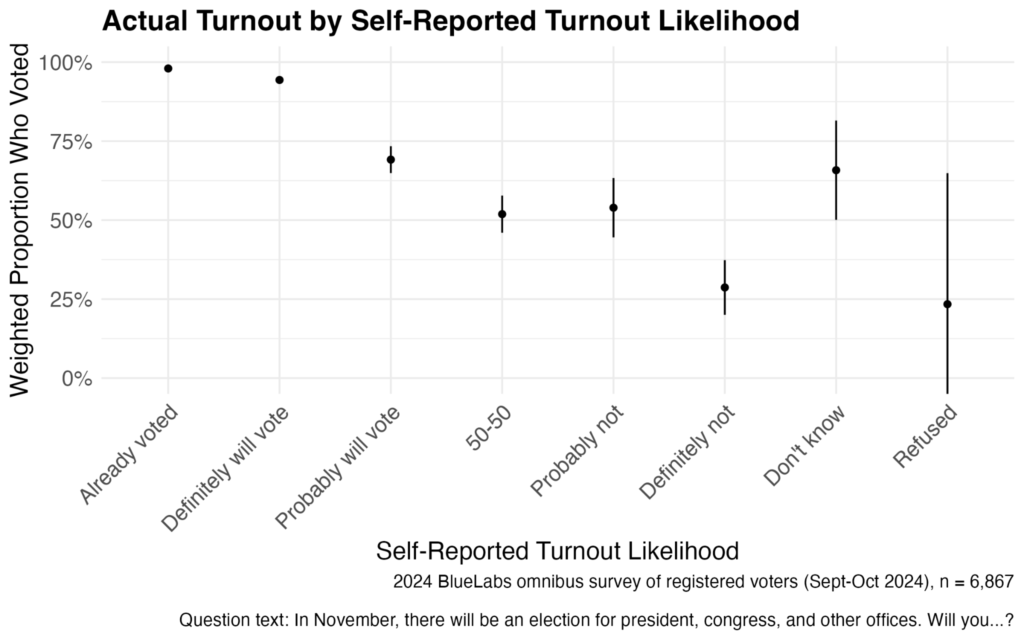
Excluding these “unlikely” voters from a sample means missing a meaningful portion of the actual electorate, one whose attitudes and priorities look very different from high-propensity voters. Keeping them in the data produces a more accurate reflection of the electorate.
What This Means
At BlueLabs, we believe that tracking a changing electorate means changing how we work. Accurate polling in 2026 must look beyond quick fixes. It requires multi-mode outreach, designing intentional oversamples of harder-to-reach voters, and retaining the “unlikely” voters who frequently surprise us at the ballot box. Understanding where the electorate is going requires talking to the people who are actually moving it.